Alerts
Watch one event metric over a rolling window and get notified on Discord, Slack, a webhook, or email the moment it breaches your rule.
An alert watches one event metric over a rolling window and notifies you when it breaches a rule you set. It is how you find out something happened without sitting and staring at a dashboard: errors spiked, signups fell off a cliff, or a service that should send a heartbeat every minute went quiet.
Everything to do with alerts lives on the Alerts page, split across three tabs:
- Alerts - the alerts themselves and their current status.
- Channels - the reusable destinations that notifications go to.
- Activity - the history of every time an alert fired or resolved.
The mental model
An alert is a question TopStats asks about your events once a minute: "over the last window, does this metric break my rule?" When the answer flips from no to yes, it fires and tells your channels. When it flips back, it resolves.
Building an alert
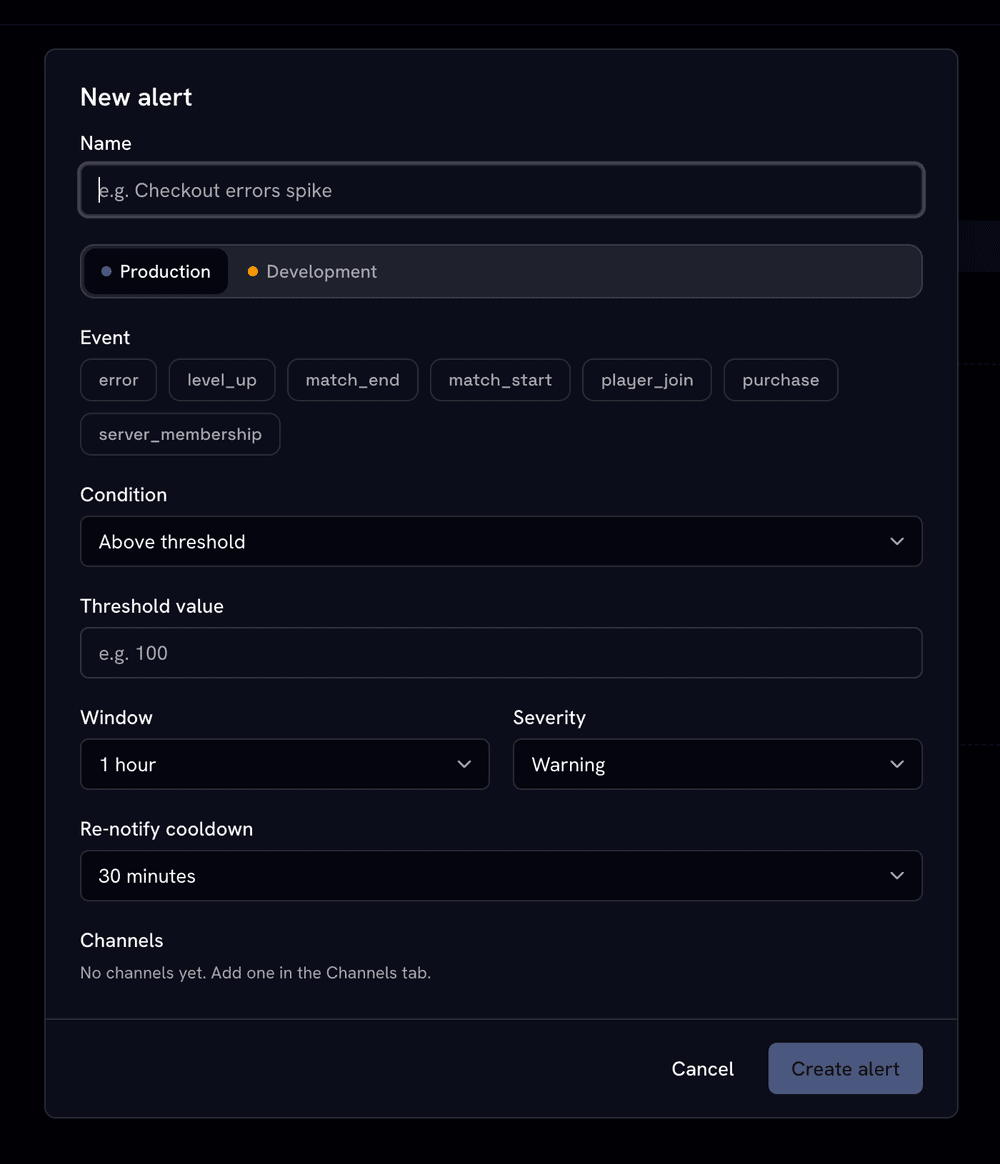
An alert is built from a handful of pieces. You put them together once in the New alert dialog, and TopStats does the watching from then on.
Pick the event and measure
Choose the event you want to watch (for example error or purchase) and what
to measure about it. The measure is either the plain count of matching
events, or an aggregate over one of the event's properties.
Add filters (optional)
Narrow the alert to a slice of that event, for example only checkout events
where country is US. You can also load filters from a saved segment to
reuse a slice you have already defined - see Segments.
Choose a condition and threshold
The condition is the rule, and the threshold is the line it compares against. The six conditions are covered in full below.
Set the window, severity, and cooldown
Decide how far back the alert looks, how loudly to label it, and how often to remind you while it is still firing. See Other settings.
Attach channels
Pick one or more channels to notify. An alert with no channels still works - it changes status and logs activity - it just does not notify anyone.
Conditions
The condition decides what counts as a breach, and it changes what the threshold number means. Pick the one that matches the question you are really asking.
| Condition | Fires when | What the threshold means |
|---|---|---|
above | The value is greater than the threshold. | An absolute value. |
below | The value is less than the threshold. | An absolute value. |
rises | The value grew by at least the threshold percent compared with the previous equal-length window. | A percent (50 means +50%). |
drops | The value fell by at least the threshold percent compared with the previous window. | A percent (30 means -30%). |
nodata | No events matched at all in the window - a silence alarm. | Not used. |
anomaly | The current window is unusually far from its recent normal, either a spike or a dip. | A sensitivity number (lower fires more easily; 2 or 3 is typical). |
Concrete examples of when you would reach for each:
above- notify me whenerrorcount goes above 100 in the last hour.below- notify me whenpurchasecount falls below 10 over a day (something upstream is probably broken).rises- notify me whensignupcount rises 50% versus the previous window (a traffic spike worth knowing about).drops- notify me whencheckout_completedrops 30% (a funnel likely broke).nodata- notify me when noheartbeatevents arrive in 15 minutes (a service went quiet).anomaly- notify me whenapi_errorstrays far from its usual level, without me having to pick an exact number.
A few things to know:
risesanddropsnever fire when the previous window was zero - there is no baseline to grow or fall from, so there is nothing to compare against.anomalycompares the current window against the metric's recent normal. It needs some recent history before it can fire, so brand-new or very sparse metrics will not false-alarm out of the gate.- The threshold field relabels itself to match the condition: Threshold value
for
aboveandbelow, Percent change forrisesanddrops, and Sensitivity foranomaly. Fornodatathere is nothing to compare, so the field is hidden.
Other settings
Beyond the condition, a few settings control how the alert behaves and how it is labelled.
| Setting | What it does | Values |
|---|---|---|
| Window | The rolling look-back the metric is measured over. | 1 to 1440 minutes (up to 24 hours). Presets: 5m, 15m, 30m, 1h (default), 3h, 6h, 12h, 24h. |
| Severity | A label carried into notifications. It does not change when the alert fires. | warning (default) or critical. |
| Re-notify cooldown | How long to stay quiet before reminding you an alert is still firing. | 1 to 1440 minutes, default 30. |
| Enable / pause | A paused alert is skipped entirely - no evaluation, no notifications. | Enabled or paused. |
| Environment | Which stream the alert watches. | One of your environments. |
| Status | The alert's current state. | OK or FIRING. |
The cooldown never mutes the important moments
The re-notify cooldown only spaces out the reminders while an alert keeps firing. It never silences the very first fire, and it never silences the resolved notice. You always hear when something starts and when it recovers.
Lifecycle
Every enabled alert is evaluated about once a minute. Paused alerts are skipped. When an alert is evaluated, one of three things happens:
- Fire. The metric breaches the rule while the alert was OK. Its status becomes FIRING, a "fired" entry is written to the Activity tab, and your channels are notified.
- Remind. The metric is still breaching. The alert stays quiet until the re-notify cooldown passes, then sends one reminder so it does not spam you.
- Resolve. The metric recovers and no longer breaches. The alert goes back to OK, a "resolved" entry is logged, and a resolved notice is sent.
An alert with no channels still runs through this whole lifecycle - it changes status and logs to Activity. It simply notifies no one. That can be handy if you only want the history and not the pings.
Channels
Channels are reusable notification destinations, managed on the Channels tab. You define a channel once and attach it to as many alerts as you like. There are four types.
| Type | You configure it with | What arrives |
|---|---|---|
| Discord | An https Discord webhook URL | A rich embed - red when firing, green when resolved. |
| Slack | An https Slack incoming webhook URL | A single text message. |
| Webhook | Any https URL | A JSON payload on every fire and resolve. |
| A valid email address | A formatted email on every fire and resolve. |
Good to know:
- URL channels must be https, and an email channel must be an actual email address, not a URL.
- The destination you save is never shown back to you in full - only a masked preview - so a webhook URL or address is not left sitting on screen.
- Send test delivers a sample firing notice to the channel right away and reports either success or the reason it failed, so you can confirm a channel works before an alert ever depends on it.
What a webhook receiver gets
If you point a Webhook channel at your own https endpoint, each fire and resolve sends a JSON payload. It includes:
- The alert's id and name.
- The status (firing or resolved) and severity.
- The condition, the observed value, and the threshold it was compared against.
- The window in minutes.
- The timestamp and the workspace.
That is enough for your receiver to route, log, or forward the alert however you like.
Alert from a widget
You do not have to build every alert from scratch. On a metric widget (a counter, timeseries, categorical, or multiseries chart) the per-widget options menu has an "Alert on this" action.
It opens the New alert dialog pre-filled with that widget's environment, event, measure, and title - so all you have to do is pick a condition and a threshold. It is the fastest way to go from "this chart looks interesting" to "tell me when it does that again."