Dashboards
A dashboard is a canvas of widgets pinned to one environment and one time range. Learn how to create one, switch its time range, and manage its settings.
A dashboard is a canvas of widgets. Each dashboard is pinned to one environment and one time range, and every widget on it reads that same environment and range. That is the whole idea: you set the environment and the window once, at the top, and every tile below answers "what happened here, in this window".
Environment and time range are shared
You do not set an environment or a time range on each widget. The dashboard owns both, so a "Production, last 24 hours" dashboard shows every one of its widgets for production over the last 24 hours. Change the range and they all move together.
Create a dashboard
Click New dashboard to open the wizard. It asks for four things.
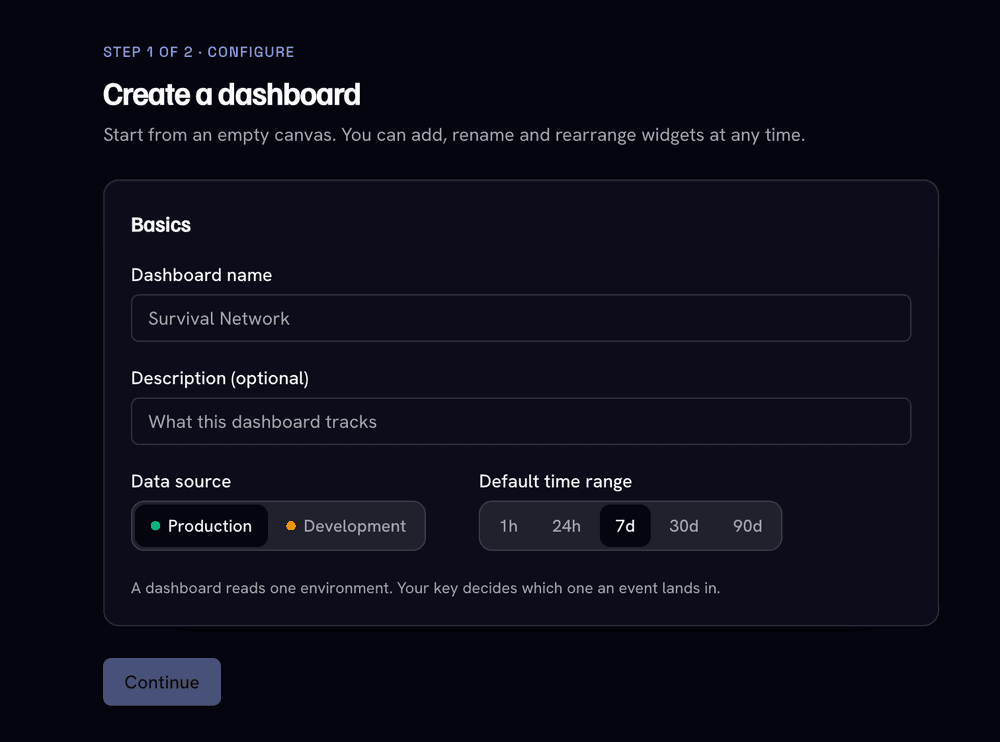
Name
A short name, 1 to 120 characters. This is how the dashboard shows up in your
list, so something like Signups overview or Game health works well.
Description (optional)
An optional note up to 280 characters explaining what the dashboard is for. Handy when a teammate opens it later and wonders why it exists.
Environment
The environment this dashboard reads from. You pick it here, at creation, and it
is fixed afterwards (see below). Choose production for your live traffic
or development for test events.
Default time range
The window the dashboard opens on, for example 24h. You can always switch this
later from the header; this is just where it starts.
The environment badge
Once created, the dashboard shows an environment badge: green for
production, amber for development. It tells you at a glance which stream of
events you are looking at.
The environment is fixed after creation
You cannot change a dashboard's environment later. The settings dialog does
not offer it. If you built a dashboard against development and now want the
same view for production, create a new dashboard and pick production at the
start.
Time ranges
Switch the time range live from the dashboard header. The choice is saved to the dashboard and moves every widget together, so you never end up comparing a chart from last week against a number from last hour.
| Range | Window |
|---|---|
1h | The last hour |
24h | The last 24 hours |
7d | The last 7 days |
30d | The last 30 days |
90d | The last 90 days |
For example, if a spike catches your eye on the 24h view, flip to 7d to see
whether it is normal for the week. Every widget on the dashboard re-reads that
new window at the same time.
Layout density
Layout density controls how tightly widgets pack onto the canvas. There are three options:
| Density | What it does |
|---|---|
comfortable | Roomy spacing between widgets. |
compact | Tighter spacing to fit more on screen at once. |
focus | Forces every widget to full width, one under another. |
Density is a per-workspace preference, not a per-dashboard setting, so changing it affects how every dashboard looks for you. It is ignored on mobile, where widgets always stack to fit the screen.
Dashboard settings
Open the gear icon to edit the dashboard. From here you can change:
- Name and description.
- A square icon (PNG, JPEG, or WebP, up to 128 KB), squared to 256 px.
The settings dialog is also where you delete a dashboard.
Deleting is permanent
Deleting removes the dashboard and all of its widgets, and it cannot be undone. There is no trash to restore it from.
Status pill: LIVE or AWAITING DATA
Every dashboard shows a status pill in its header:
- AWAITING DATA means events have not arrived yet for this environment. A new dashboard sits here until your first event lands.
- LIVE means data is flowing. Widgets refresh in near real time, with a slow background refetch as a safety net so nothing goes stale.
So if a brand new dashboard looks empty, check the pill: AWAITING DATA usually
just means you have not sent an event to that environment yet, not that anything
is broken.
Who can read and edit
Reading is open, editing needs Developer
Any workspace member can read a dashboard, including Viewers. Creating or editing dashboards and their widgets needs the Developer role or higher.
Next
A dashboard is only as useful as the widgets on it. Widgets are the individual tiles, the numbers, charts, tables, funnels, and more.